
One of the most valuable prompt engineering techniques is task decomposition—the process of breaking a large, complex problem into a series of smaller, focused prompts.
Instead of asking an AI model to build an entire application in a single prompt, we divide the problem into independent steps. Each prompt has a single objective and produces one reusable function. These functions can then be combined to form a complete solution.
EXAMPLE 1
Original Prompt
Write me a python code that would take input a csv file which located on git hub at url, drops all non-numerical data from it, drops row that have missing values, prints the mean, standard deviation and correlation coefficient among all numerical columns. It also plots a correlation heatmap using seaborn or matplotlib and save the plot as a PNG image. Finally save dataframe in an excel format and also save it in an parquet format
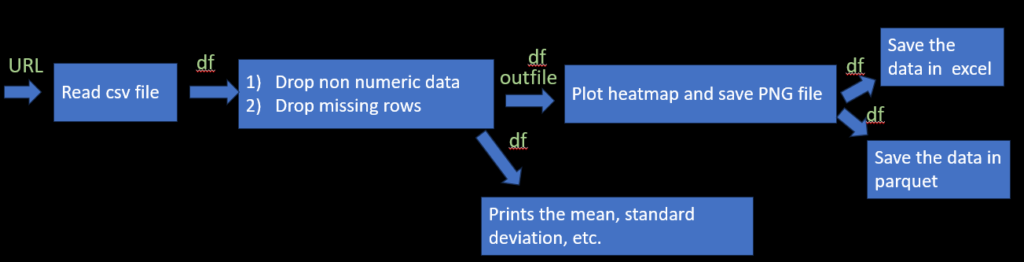
We would test this on URL=https://raw.githubusercontent.com/ash322ash422/data/refs/heads/main/MPG.csv
Here AI may struggle because it is long task. So, we break this into series of smaller task.
Decomposed Prompt
Prompt 1 – Read a CSV from a GitHub URL
Role:
You are a Senior Python Developer and Data Engineer. You specialize in writing clean, production-quality Python code that is modular, well-documented, memory-efficient, and easy to maintain. You follow Python best practices, include proper error handling, use type hints, and write code suitable for reuse in larger projects.
Task:
Write a Python function named load_csv_from_url().
The function must satisfy the following requirements:
- Accept a single input parameter named url, which contains the URL of a CSV file hosted on GitHub or another web server.
- Download and read the CSV file directly into a pandas DataFrame.
- Return the DataFrame.
- Validate that the URL is a string.
- Handle errors
- Return only the function code.
Prompt 2 – Clean the DataFrame
Role:
You are a Senior Python Developer and Data Engineer. You specialize in writing clean, production-quality Python code that is modular, well-documented, memory-efficient, and easy to maintain. You follow Python best practices, include proper error handling, use type hints, and write code suitable for reuse in larger projects.
Task:
Write a Python function named clean_numeric_dataframe().
The function must satisfy the following requirements:
- Accept a single input parameter named df, which is a pandas DataFrame.
- Remove all non-numeric columns from the copied DataFrame.
- Remove all rows containing one or more missing (NaN) values.
- Handle errors that may arise
- Return the cleaned DataFrame.
- Return only the function code.
Prompt 3 – Compute Descriptive Statistics
Role:
You are a Senior Python Developer and Data Engineer. You specialize in writing clean, production-quality Python code that is modular, well-documented, memory-efficient, and easy to maintain. You follow Python best practices, include proper error handling, use type hints, and write code suitable for reuse in larger projects.
Task:
Write a Python function named display_dataframe_statistics().
The function must satisfy the following requirements:
- Accept a single input parameter named df, which is a pandas DataFrame containing only numerical data.
- Handle cases if the DataFrame is empty.
- Compute the following statistics for every numerical column:
- Mean
- Standard deviation
- Compute the correlation matrix for all numerical columns using Pearson correlation.
- Display the results in a clear, readable format with appropriate headings.
- The function should print the statistics and correlation matrix. It should not return any value.
- Return only the function code.
Prompt 4 – Generate a Correlation Heatmap
Role:
You are a Senior Python Developer and Data Engineer. You specialize in writing clean, production-quality Python code that is modular, well-documented, memory-efficient, and easy to maintain. You follow Python best practices, include proper error handling, use type hints, and write code suitable for reuse in larger projects.
Task:
Write a Python function named plot_correlation_heatmap().
The function must satisfy the following requirements:
- Accept two input parameters:
- df: A pandas DataFrame containing only numerical data.
- output_file: A string specifying the name (or path) of the PNG image to be created.
- Compute the Pearson correlation matrix for the DataFrame.
- Create a correlation heatmap using seaborn (preferred) or matplotlib.
- The heatmap should include: A title, Axis labels, Correlation coefficient annotations inside each cell, an appropriate color map
- Save the heatmap as a PNG image using the filename specified in output_file.
- Handle errors
- The function should not display the plot on the screen.
- Return only the function code.
Prompt 5 – Save the DataFrame as an Excel File
Role:
You are a Senior Python Developer and Data Engineer. You specialize in writing clean, production-quality Python code that is modular, well-documented, memory-efficient, and easy to maintain. You follow Python best practices, include proper error handling, use type hints, and write code suitable for reuse in larger projects.
Task:
Write a Python function named save_dataframe_to_excel().
The function must satisfy the following requirements:
- Accept two input parameters:
- df: A pandas DataFrame.
- output_file: A string specifying the name (or path) of the Excel file to be created.
- Save the DataFrame in Excel (.xlsx) format using pandas.
- If the parent directory in output_file does not exist, create it automatically.
- Handle errors
- Return only the function code.
Prompt 6 – Save the DataFrame as a Parquet File
Role:
You are a Senior Python Developer and Data Engineer. You specialize in writing clean, production-quality Python code that is modular, well-documented, memory-efficient, and easy to maintain. You follow Python best practices, include proper error handling, use type hints, and write code suitable for reuse in larger projects.
Task:
Write a Python function named save_dataframe_to_parquet().
The function must satisfy the following requirements:
- Accept two input parameters:
- df: A pandas DataFrame.
- output_file: A string specifying the name (or path) of the Parquet file to be created.
- Save the DataFrame in Apache Parquet (.parquet) format using pandas.
- If the parent directory in output_file does not exist, create it automatically.
- Handle errors
- Return only the function code.
EXAMPLE 2
Original Prompt:
Write a complete 10-page market research report for a new coffee shop in Tokyo, including demographic data, competitor analysis, and marketing strategies
The output will likely be generic, brief, and full of hallucinated data because the model is trying to do too many things at once
Optimized Prompt: The 3-Step Chained Prompt Format
Prompt 1: Data Structuring & Fact Extraction
Here the goal is: Force the model to focus strictly on data aggregation before writing any narrative paragraphs.
“Act as a senior market research analyst. I want to open an artisanal coffee shop in downtown Moscow. Your first task is to create a detailed outline of the exact target demographic (age, income bracket, daily habits) and list the top 3 direct competitors in that specific area. Do not write the introduction or conclusion yet. Present your findings in a structured bulleted list.”
Prompt 2: Contextual Analysis (Building on Step 1)
Here the goal is: Use the output from the first prompt to generate the core analytical content.
“Review the target demographic and competitor data you just generated. Based only on that specific information, perform a SWOT analysis (Strengths, Weaknesses, Opportunities, Threats) for my new coffee shop. Focus heavily on how we can exploit the specific weaknesses of the 3 competitors you identified.”
Prompt 3: Strategy & Action Plan (Final Assembly)
Here the goal is: Take the analytical insights and turn them into final, actionable strategies.
“Now, take the SWOT analysis from our previous step. Write a 3-month launch marketing strategy targeting the exact demographic we defined in Step 1. Include specific social media tactics, local partnership ideas, and a soft-opening plan. Keep the tone professional, persuasive, and execution-focused.”
EXAMPLE 3
Original Prompt: Design a 12-week data science course
The LLM will generate a superficial list of weekly topics without deep learning objectives, assessments, or weekly exercises.
Solution:
Prompt 1: The Blueprint (Scope and Sequence)
Goal: Establish the macro-level structure, prerequisites, and learning outcomes before writing any specific lessons.
“Act as an expert instructional designer. I need to build a 12-week intensive bootcamp for ‘Data Science with Python’ aimed at absolute beginners. Your first task is to define the overall course prerequisites, 5 major high-level learning outcomes, and a macro-level 12-week syllabus outline (just the module titles for each week). Do not write any lesson plans or content yet. Format this as a clean structural outline.”
Prompt 2: Deep Dive into Modules (The Weekly Breakdown)
Goal: Take the macro outline from Prompt 1 and flesh out the specific weekly objectives and technical tools.
“Using the 12-week syllabus outline we just generated, focus exclusively on Weeks 1 through 4. For each of these four weeks, break down: 1) The specific core concepts to teach, 2) The exact software tools or Python libraries to introduce, and 3) The common pitfalls or misunderstandings beginners face during these specific topics. Do not write the assignments yet.”
Prompt 3: Assessment and Project Design
Goal: Create evaluation methods tied directly to the learning outcomes established in the previous steps.
“Now that we have the detailed breakdown for Weeks 1 to 4, design the assessments for this first month. Provide instructions for one minor practical quiz for Week 2, and a comprehensive portfolio project at the end of Week 4. For the project, include clear student instructions, the raw dataset requirements, and a 4-category grading rubric (Beginner, Intermediate, Advanced).”
Prompt 4: Day-by-Day Lesson Planning & Delivery
Goal: Generate the actual micro-content, lecture scripts, and hands-on activities for a single day.
“Let’s zoom into Week 3, Day 1 (which covers Pandas DataFrames). Write a highly detailed, 60-minute lesson plan. Break it down minute-by-minute: a 10-minute hook/introduction, a 20-minute conceptual lecture with a short Python code snippet example, a 25-minute live coding lab activity for students, and a 5-minute wrap-up reflection question. Provide the exact text/prompts the instructor should say during the live coding section.”